.png)

The KPIs That Actually Matter in Behavioral Health
An Executive Guide to Billing, Operations, and Sustainable Growth
Why KPIs Are Existential in Behavioral Health
Behavioral health organizations operate in one of the most constrained reimbursement environments in healthcare. According to the Medicare Payment Advisory Commission (MedPAC) and CMS program integrity audits, behavioral health providers experience higher denial rates, longer payment cycles, and greater documentation scrutiny than most medical specialties.
Organizations that outperform peers do not rely on volume. They rely on measurement discipline.
High‑performing treatment programs treat KPIs as governance tools, not billing reports.
I. Revenue Cycle KPIs (Billing‑Critical)
1. Clean Claim Rate (First‑Pass Acceptance)
Target Benchmark: ≥95%
Why it matters:
- CMS reports that first‑pass acceptance is the single strongest predictor of payment speed
- Rejections increase cost per claim by 20–35% (HFMA MAP Key data)
Graph Recommendation:
- Line chart: Clean Claim Rate vs Days to Payment
Sources:
- HFMA MAP Key Program
- CMS Program Integrity Manual, Ch. 6
2. Days to Payment (By Payer)
Benchmarks:
- Commercial: 18–30 days
- Medicaid/Government: 30–45 days
Executive Insight:Tracking averages hides payer behavior. High‑performing organizations track:
- Payer‑specific payment velocity
- Level‑of‑care reimbursement lag
- UB‑04 vs CMS‑1500 performance
Graph Recommendation:
- Bar chart: Average Days to Payment by Payer
Sources:
- CAQH Index
- CMS Timely Filing & Prompt Pay Standards
3. Net Collection Rate (NCR)
Target: ≥98%
Why Boards Care:Net Collection Rate isolates execution failure from payer issues. Anything below benchmark indicates underpayment leakage.
Graph Recommendation:
- Stacked bar: Allowed vs Collected Revenue
Sources:
- HFMA Revenue Cycle Benchmarks
4. Denial Rate & Appeal Win Rate
Targets:
- Denial Rate: <5%
- Appeal Success: >65%
Key Insight:Appeal volume is meaningless without win rate. Low win rates signal documentation misalignment with ASAM, MCG, or payer medical policy.
Graph Recommendation:
- Dual‑axis: Denial Rate vs Appeal Win Rate
Sources:
- OIG Behavioral Health Audits
- ASAM Criteria, 4th Edition
II. Operational KPIs Used by High‑Performing Programs
5. Authorization Utilization Accuracy
Target: ≥97%
Risk Exposure:Authorization mismatch is one of the top causes of retro‑denials in behavioral health (OIG).
Graph Recommendation:
- Heat map: Authorized vs Delivered Units
Sources:
- CMS Managed Care Manual
- State Medicaid UM Guidelines
6. Clinical Documentation Lag Time
Target: ≤24 hours
Why it matters:Delayed documentation increases denial probability and weakens appeal leverage.
Graph Recommendation:
- Scatter plot: Documentation Lag vs Denial Rate
Sources:
- Joint Commission Behavioral Health Standards
7. Census Stability & Average Length of Stay (ALOS)
Executive Use Case:ALOS trends predict:
- Revenue volatility
- Staffing needs
- Payer pressure cycles
Graph Recommendation:
- Trend line: Census vs ALOS over time
Sources:
- SAMHSA Treatment Episode Data Set (TEDS)
III. Executive & Investor‑Grade KPIs
8. Revenue Predictability Index
A composite KPI combining authorization runway, payer velocity, and AR quality.
Why it matters:This metric is routinely requested in:
- Private equity diligence
- Bank underwriting
- Strategic acquisitions
Graph Recommendation:
- Dashboard gauge: Predictability Score
Sources:
- Behavioral Health M&A Advisory Benchmarks
9. Cost Per Collected Dollar
Target: Declining trend
Key Insight:Revenue growth without efficiency gains erodes margins.
Graph Recommendation:
- Line chart: Cost per Dollar Collected vs Revenue Growth
Sources:
- HFMA Cost‑to‑Collect Studies
The KPI Failure Mode Most Programs Never See
Most organizations measure outcomes, not drivers.
KPIs must inform:
- Payer negotiations
- Staffing models
- Technology investment
- Clinical workflow design
If leadership cannot explain why a KPI moved, the KPI is decorative.
Final Executive Takeaway
In behavioral health, KPIs are not operational trivia. They are leverage.
Organizations that win reimbursement pressure:
- See payer behavior early
- Align clinical, billing, and finance teams
- Make decisions before cash flow breaks
This is the difference between surviving — and scaling.
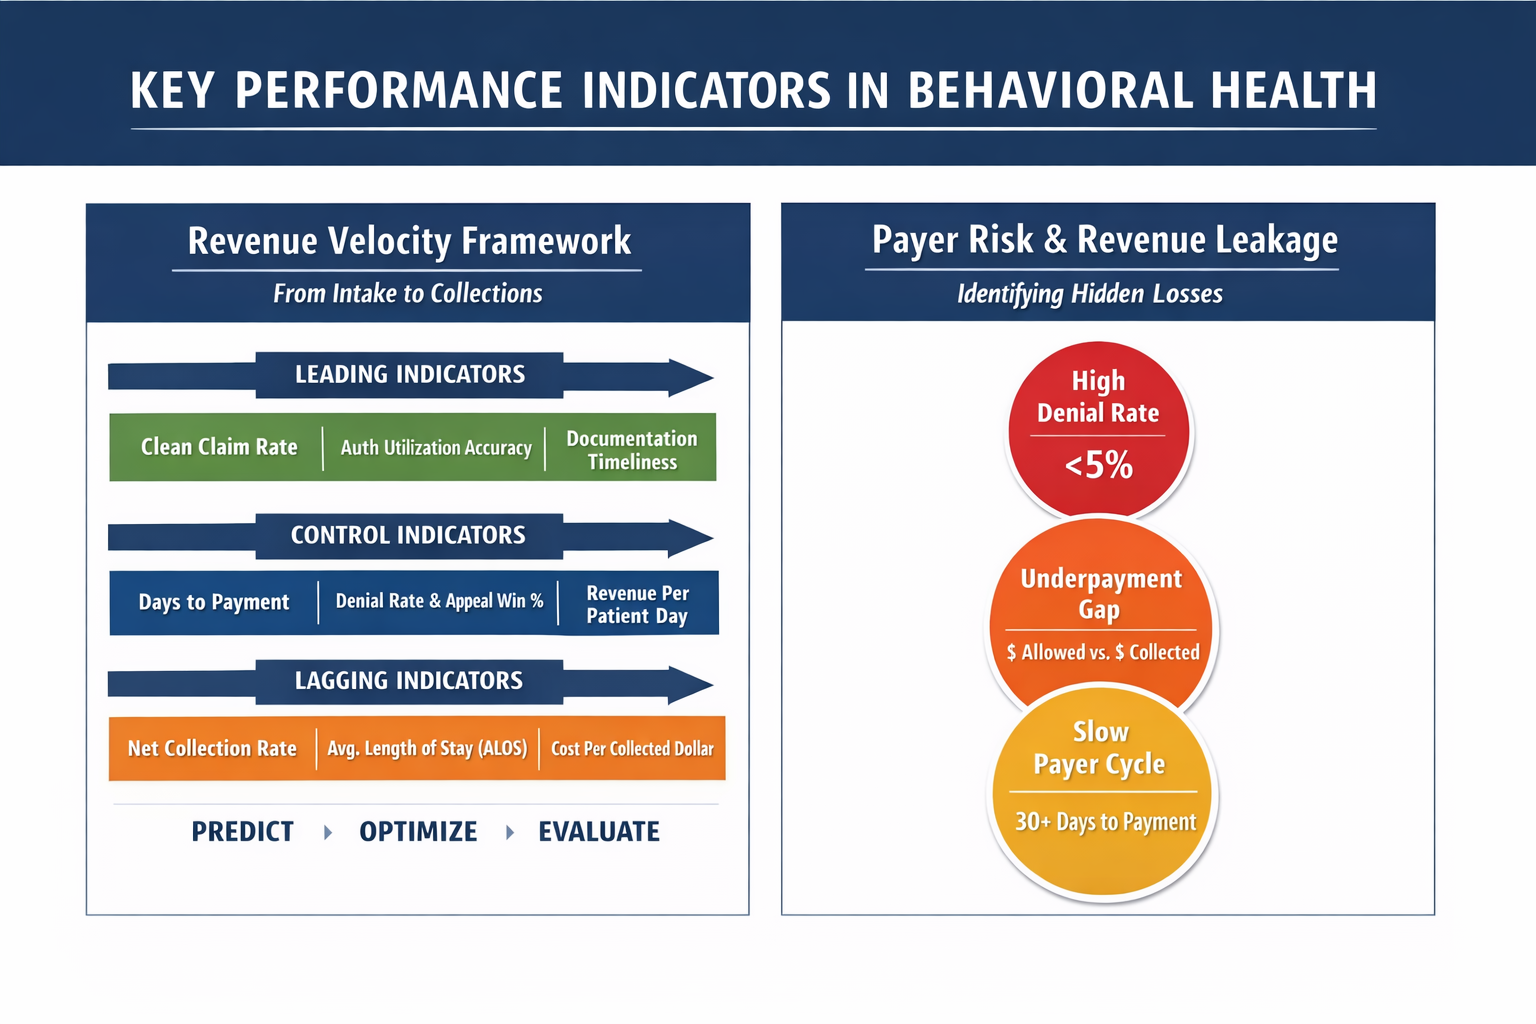
One-Page KPI Framework for Behavioral Health Executives
A unified view connecting clinical care, payer behavior, and financial performance.
The Hartstone & Craft Behavioral Health KPI Framework
Layer 1: Clinical & Utilization Drivers (Leading Indicators)
- Authorization Utilization Accuracy
- Clinical Documentation Lag Time
- Average Length of Stay (ALOS)
- Level-of-Care Integrity (ASAM alignment)
Layer 2: Revenue Cycle Execution (Control Metrics)
- Clean Claim Rate (First-Pass Acceptance)
- Days to Payment (by payer & claim type)
- Denial Rate & Appeal Win Rate
- Net Collection Rate
Layer 3: Financial & Executive Outcomes (Lagging Indicators)
- Revenue per Patient Day (RPPD)
- Cost per Collected Dollar
- Revenue Predictability Index
- Cash Flow Coverage Ratio
Executive Insight: High-performing organizations focus on Layer 1 first. Layer 3 results are symptoms, not levers.
Sample Executive Dashboard (Board & CEO View)
Below is a model executive dashboard structure used by scalable behavioral health organizations. This is not a billing report — it is a decision tool.

Executive Summary (Top Row)
- Current Census: 78 (▲ +6 WoW)
- Authorized Days Remaining: 412
- Projected 30-Day Cash Inflow: $1.84M
- Revenue Predictability Score: 87 / 100
Revenue Velocity Panel / Payer Risk & Revenue Leakage
Clinical-to-Financial Alignment Panel
- Documentation Lag (Avg): 18 hours
- Authorization Match Rate: 98.4%
- RPPD Trend: ▲ +4.2% QoQ
This panel is where most organizations discover revenue loss they didn’t know existed.
What Most Behavioral Health Programs Miss
1. Denials Are Lagging Indicators
By the time denial rates rise, the operational failure occurred weeks earlier — usually in intake, authorization management, or documentation timing.
Missed Cost: 3–7% of annual net revenue
2. Revenue Predictability Matters More Than Revenue Size
Programs fail not because revenue is too low, but because it is unpredictable.
Lenders, investors, and acquirers value:
- Stable authorization runway
- Consistent payer payment behavior
- Low AR volatility
3. Underpayments Quietly Outperform Denials in Revenue Loss
Most organizations aggressively fight denials while ignoring underpaid claims that were never denied.
Observed Impact: $250K–$1.2M annually for mid-sized programs
4. KPIs Without Ownership Are Decorative
If no executive owns a KPI — it does not drive behavior.
High-performing organizations assign:
- Clinical KPIs to Clinical Leadership
- Revenue KPIs to Finance & RCM Leadership
- Predictability KPIs to the Executive Team
The KPI Category Most Programs Avoid — and Why It Matters Most
Measuring Patient Outcomes and Treatment Effectiveness
Financial performance without outcome measurement is not success — it is unverified throughput.
The most durable behavioral health organizations track patient outcomes with the same rigor they apply to revenue, because outcomes are ultimately what determine:
- Long-term payer relationships
- Network participation and rate negotiations
- Accreditation standing
- Investor and lender confidence
- Brand credibility and referral flow
Programs that cannot demonstrate effectiveness eventually lose leverage — regardless of census or revenue.
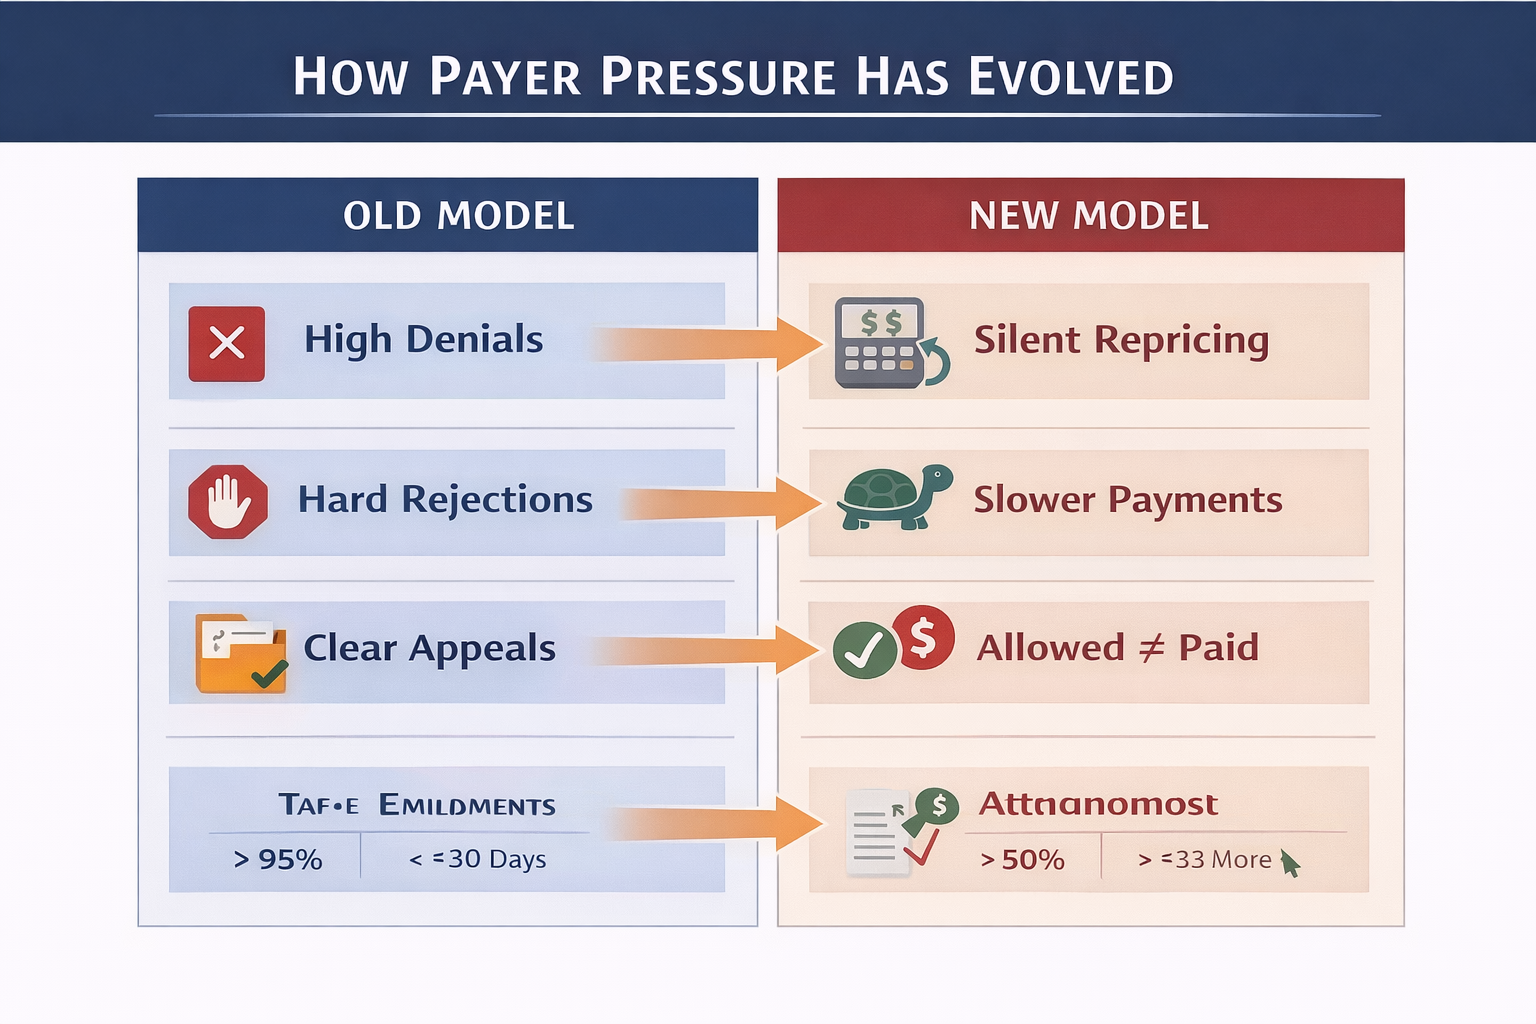
Why Outcomes Must Be Measured Alongside Revenue KPIs
Regulators, payers, and accrediting bodies are increasingly aligned on one principle:
Reimbursement sustainability follows demonstrable outcomes.
CMS, Medicaid MCOs, and commercial payers are steadily shifting toward:
- Value-based purchasing
- Performance benchmarking
- Outcomes-driven contracting
- Network rationalization based on results
Programs that measure outcomes early gain negotiation leverage later.
Core Patient Outcome KPIs High-Performing Programs Track
1. Treatment Completion Rate
Target: Program- and LOC-specific, trend stability matters more than raw percentage
Measures the percentage of patients who complete a clinically appropriate course of treatment versus early discharge or AMA.
Why it matters:
- Strong predictor of sustained recovery
- Correlates with payer satisfaction
- Signals program integrity and engagement quality
Low completion rates often point to:
- Poor clinical-financial alignment
- Authorization pressure mismanagement
- Inadequate patient engagement protocols
2. Clinical Improvement Index (Pre- vs Post-Treatment)
High-performing programs quantify improvement using standardized instruments, such as:
- PHQ-9 (depression)
- GAD-7 (anxiety)
- AUDIT / DAST (substance use)
- LOCUS / ASAM reassessments
Key KPI:
Percentage of patients showing clinically meaningful improvement from intake to discharge
This transforms outcomes from anecdotal to defensible.
3. Readmission & Relapse Rate (30 / 60 / 90 Days)
Target: Declining trend over time
Readmissions are not always failures — but unmanaged patterns are red flags.
Tracked correctly, this KPI:
- Validates treatment durability
- Informs step-down and aftercare design
- Protects payer trust
Programs that track this well are far better positioned in payer negotiations and audits.
4. Length-of-Stay Effectiveness Ratio
A powerful but underused metric
This compares:
- Clinical improvement achieved
- Relative to days in treatment
Why it matters:
- Identifies under-treatment and over-extension
- Aligns clinical outcomes with utilization
- Supports defensible authorization extensions
This KPI is especially persuasive with utilization management teams.
5. Post-Discharge Engagement Rate
(Aftercare attendance, outpatient follow-through, follow-up compliance)
Why it matters:
- Predicts long-term outcomes
- Demonstrates continuity of care
- Strengthens payer confidence in program design
Strong post-discharge engagement often correlates with lower payer scrutiny over time.
The Executive Insight Most Programs Miss
Most organizations track what happened — not what worked.
High-performing programs ask:
- Which interventions produce the strongest outcomes?
- Which patient profiles benefit most from each level of care?
- Where does additional length of stay stop producing marginal benefit?
This insight drives:
- Smarter clinical design
- Stronger authorization narratives
- Better payer leverage
- More defensible revenue models
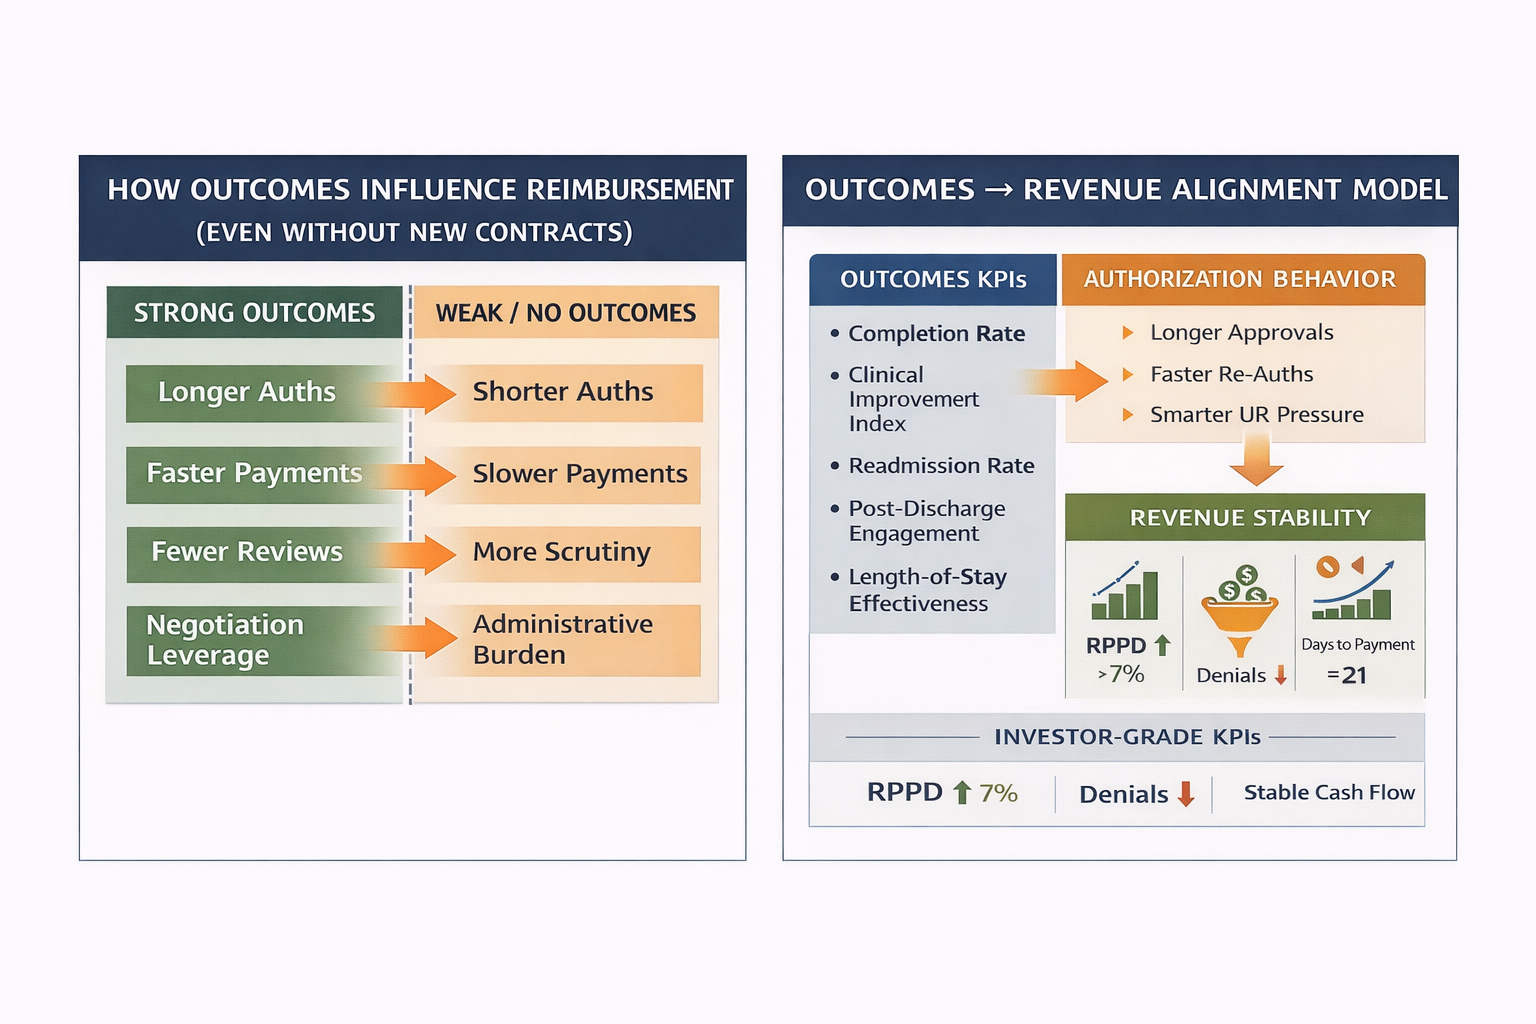
How Outcomes KPIs Integrate With Revenue & Payer Strategy
When outcomes KPIs are connected to financial KPIs, leadership gains a powerful advantage:
- Better appeals: Outcomes data strengthens medical necessity arguments
- Better contracts: Demonstrated effectiveness supports rate negotiations
- Lower denials: Payers scrutinize high-outcome providers less aggressively
- Stronger valuations: Investors reward programs with measurable impact
Outcomes are not just clinical metrics — they are strategic assets.
What Elite Programs Do Differently
They assign ownership to outcomes KPIs.
- Clinical leadership owns improvement metrics
- Executive leadership owns outcome trends
- Finance connects outcomes to payer performance
If outcomes are everyone’s responsibility, they are no one’s priority.
Final Perspective: Outcomes Are the Ultimate KPI
Revenue sustains a program.
Outcomes justify its existence.
In behavioral health, the future belongs to organizations that can prove — with data — that they deliver meaningful, durable change for patients and operate sustainably within reimbursement constraints.
Anything less is temporary.
Executive Perspective
Behavioral health sustainability is no longer about volume, effort, or intent.
It is about visibility — into payer behavior, clinical execution, and financial outcomes — before problems appear.
The organizations that win do not react faster.They see earlier.
About Hartstone & Craft
Hartstone & Craft partners with behavioral health organizations to design KPI frameworks that connect clinical reality, reimbursement mechanics, and executive decision-making.
We do not deliver reports.We deliver visibility.